It's a first look - this introduction to digital storage oscilloscopes (DSOs) takes you on a quick but comprehensive tour of DSO functions and measurements.
An oscilloscope measures and displays voltage signals on a time-versus-voltage graph. In most applications the graph shows how the signal changes over time: the vertical (Y) axis represents voltage, and the horizontal (X) axis represents time.
This simple graph can tell you many things about a signal:
- View the signal for anomalies
- Calculate the frequency of an oscillating signal
- Tell if a malfunctioning component is distorting the signal
- Tell how much of the signal is noise and whether the noise is changing with time
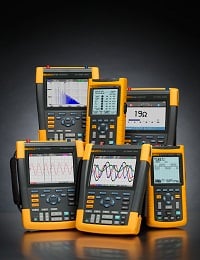
Today's handheld digital storage oscilloscopes offer two critical advantages over benchtop models: they are battery operated, and they use isolated, electrically floating inputs.
These designs make safety-certified measurements possible in 1000 V CAT III and 600 V CAT IV environments - a critical need for safely troubleshooting electrical devices in high-energy applications.
The complete article, "A first look at DSOs," tells you much more. It compares oscilloscopes and digital multimeters (DMMs) and explains sampling and triggering. You'll find instructions for setup that explain starting with auto, adjusting vertical and horizontal settings, and adjusting trigger settings. Then it covers understanding and reading waveforms, waveform anomalies, diagnosing problems, and troubleshooting.